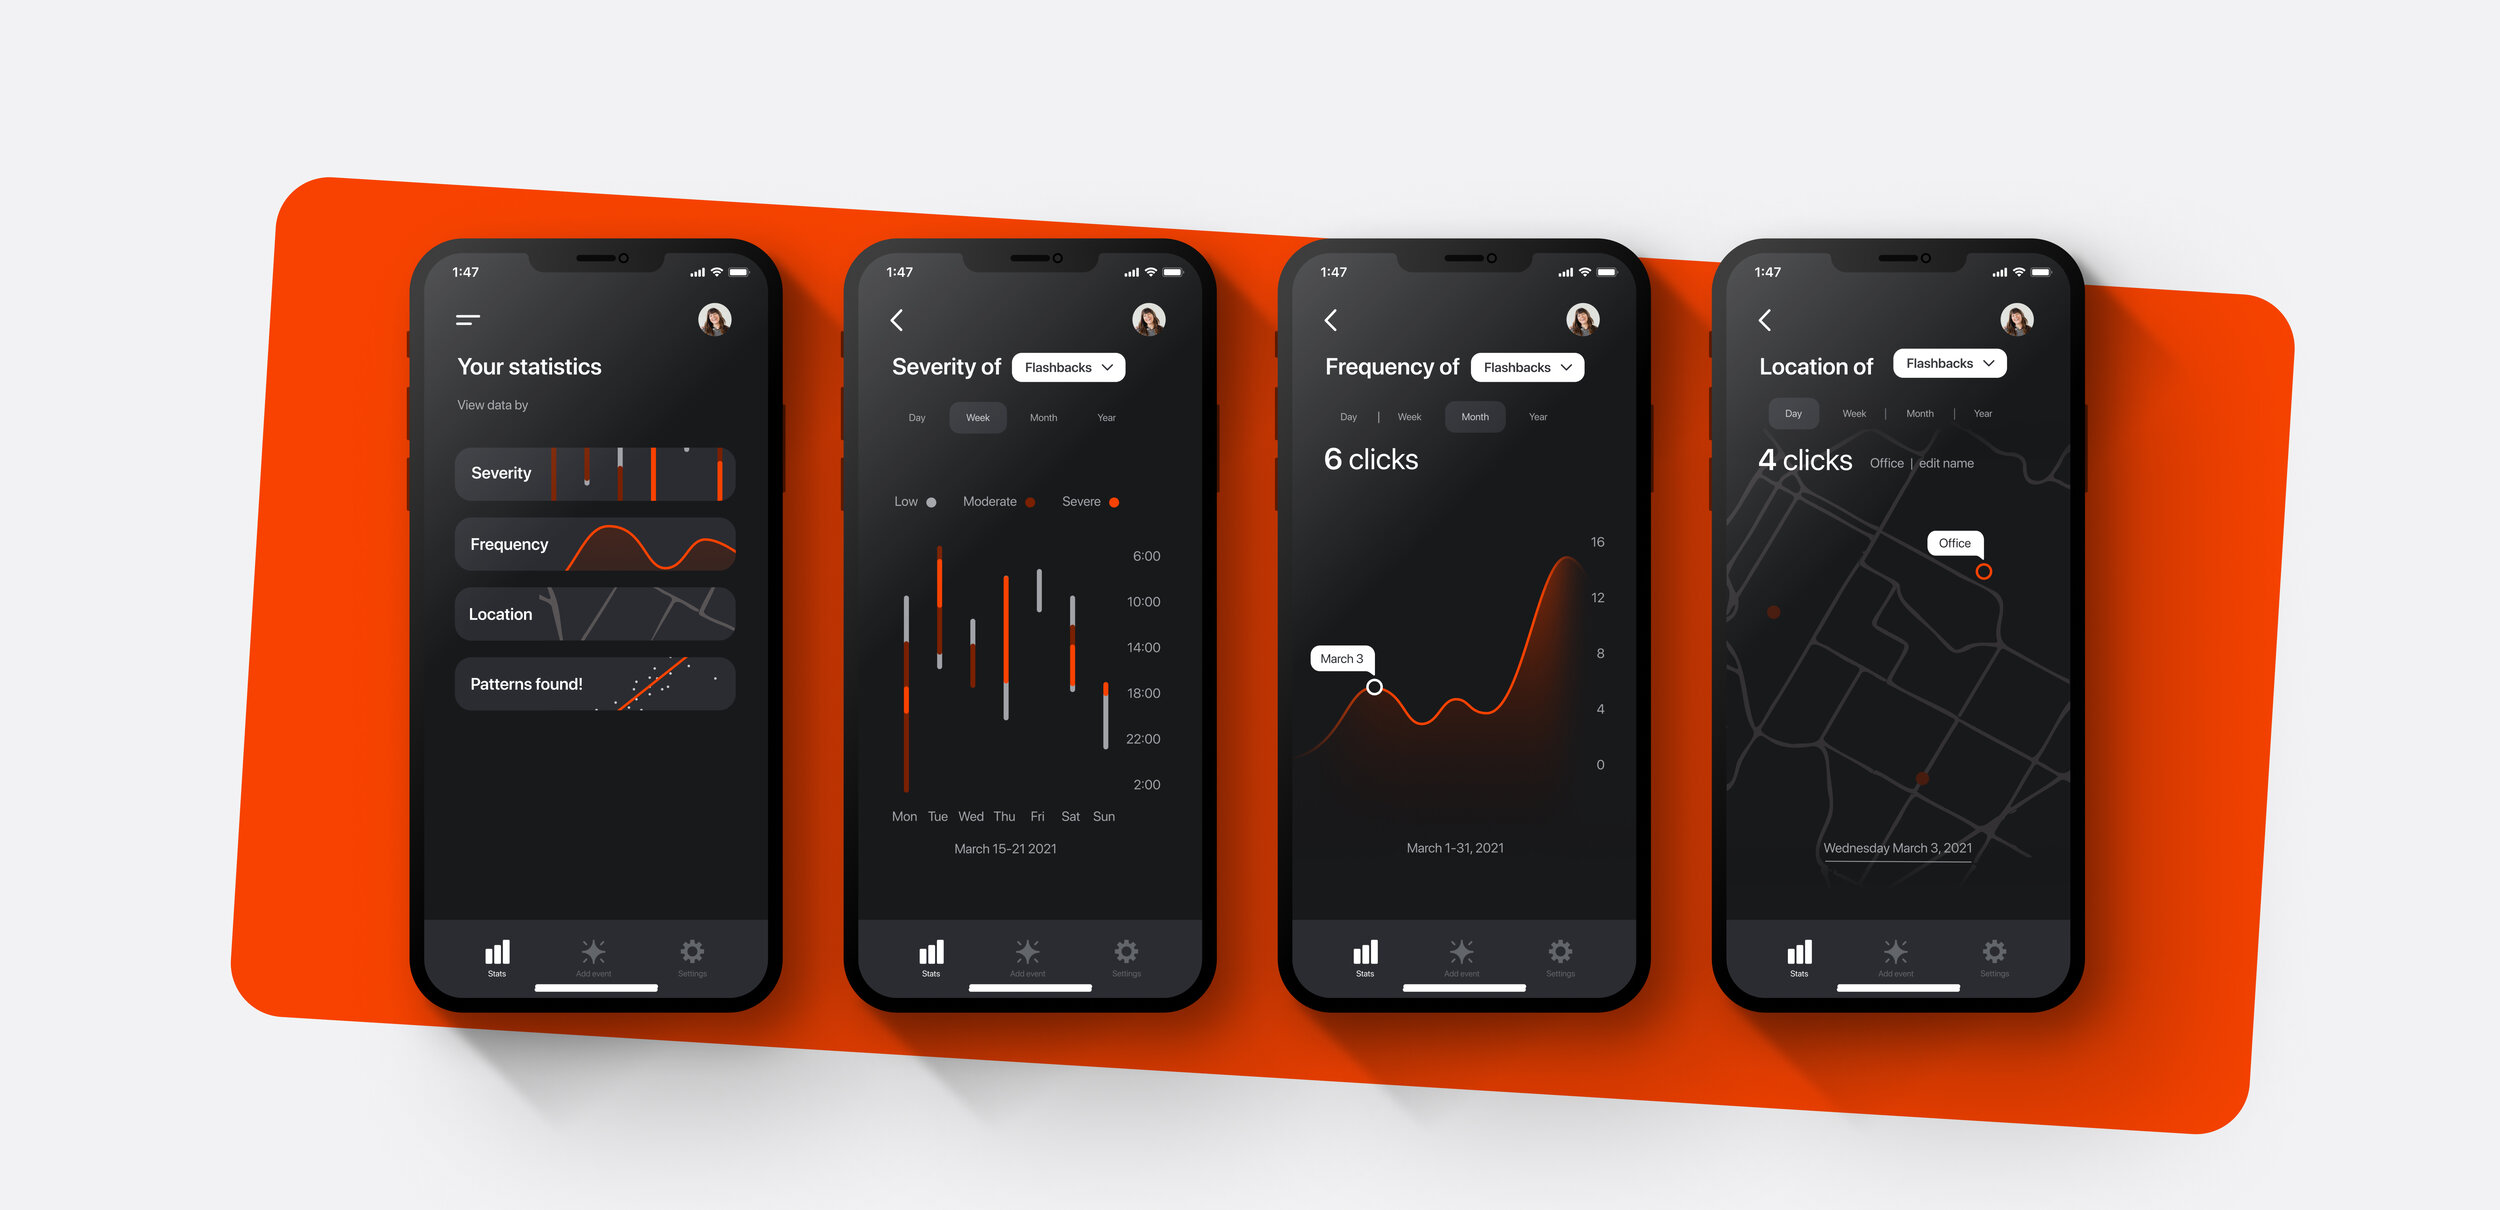
Data overview
I wanted to make the data easy to understand, intuitive to maneuver, and provide multiple ways to filter the data, then analyze the feedback to help the person create new patterns. This data could be sent back to the therapist.

A display of the severity of symptoms

This communicates the frequency of symptoms

This displays the locations where symptoms are most prevalent.
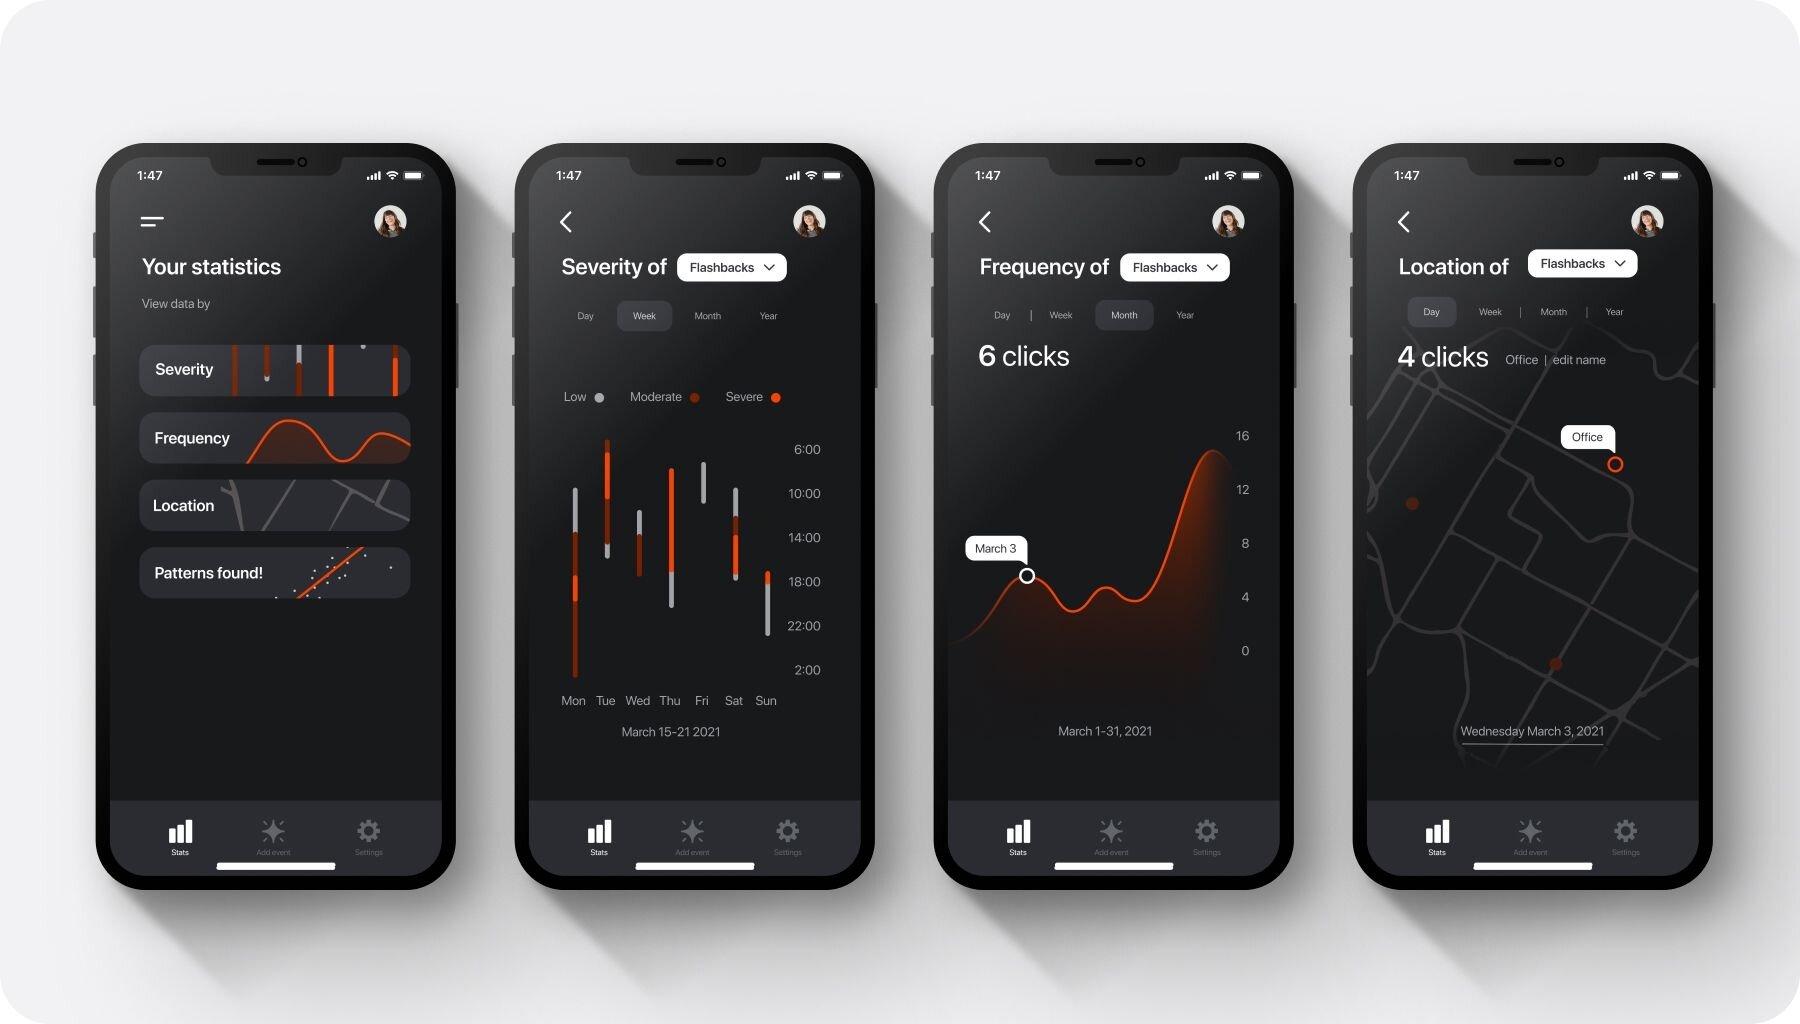

Prototype
This prototype shows how I chose to visualize the data on the app. I designed everything including the design system, illustrations, flows, animations, and UI on this prototype.